Thank you for publishing this thread model, Jonas—it’s a thoughtful starting point for discussing Polkadot’s economic resilience. However, I believe it overlooks key dynamics that could undermine its applicability, particularly in a real-world PoS environment where validators aren’t static actors.
One major gap is the scenario where validators flee to a competitor’s chain for better yields, effectively reducing the lower bound for an attack in your model. If a rival chain offers higher expected profits over the same period (e.g., via superior staking rewards or token appreciation), the exodus lowers Polkadot’s active validator count, proportionally shrinking the attack cost threshold. While your bribery-focused scenarios (lower bound via self-stake and annuities) capture similar effects in outcome, they don’t account for this capital flight, which is driven by opportunity costs rather than direct adversarial collusion.
This ties into the exogenous value of DOT—its “real” inflation when measured against pegged assets like USDT, USDC, or USD, not just issuance. If DOT’s market price drops 50% due to external factors (e.g., broader crypto sentiment or dilution from reforms), the attack cost in fiat terms halves, even if gains for the attacker are similarly affected. Attackers would weigh this post hoc, but your static model misses how price volatility directly scales security metrics.
Your analysis is inherently non-dynamic: validators can enter or exit at will, yet the model assumes series of static sets on an annual basis (e.g., 0 to 600 active validators in the graphics). Though this is useful for the dynamic analysis, the model is static for every one of this count sets. In reality, if collusion temptations arise, validators are more likely to exit the risk entirely for alternative investments outside Polkadot, worsening the scenario of your analysis hence pushing your graphical analysis to the left side. A comprehensive model should incorporate expected DOT price, as supporters of Hard Pressure (e.g., the 178.8K DOT backing Referendum 1710 to date) likely anticipate for price to rise, which would linearly boost resilience under your model for every gained dollar in DOT’s price—but this exogenous factor is deliberately not measured here, limiting the model’s utility to basic education on general equilibrium theory for software engineers (Ceteris paribus analysis).
To better model dynamic issuance schedule modifications, I suggest leveraging the Bellman equation from dynamic programming. This reduces the problem into recursive subproblems, optimizing decisions over time under uncertainty. For instance, define a state ( s_t ) at time ( t ) including variables like current validator count ( N_t ), staking rate ( r_t ), DOT price ( p_t ), and issuance schedule. The value function ( V_t(s_t) ) for a validator (or attacker) could represent the expected utility from optimal actions:
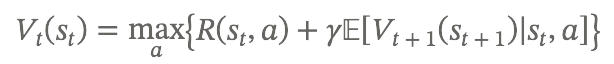
[V_t(s_t) = \max_a \left{ R(s_t, a) + \gamma \mathbb{E}[V_{t+1}(s_{t+1}) | s_t, a] \right}]
Where:
- ( a ) is the action: stay honest (validate), exit (to another chain or asset), or attack (collude/bribe).
- ( R(s_t, a) ) is the immediate reward: for honest, staking yields minus opportunity costs; for exit, returns from alternatives (e.g., Ethereum yields); for attack, bounty minus slashed stake, adjusted by success probability.
- ( \gamma ) is a discount factor (e.g., your 8% but time-varying).
- Transitions ( s_{t+1} ) depend on collective actions: e.g., mass exits drop ( N_{t+1} ), reducing security and potentially ( p_{t+1} ) via market feedback; price changes could be modeled with liquidity thresholds (e.g., demand needed to shift price by $1 USD/USDC).
- The overall attack cost emerges as the threshold where attacking maximizes ( V ) for enough actors to reach 1/3+1 validators.
This approach is superior to your static perpetual annuity model because it captures sequential, adaptive behavior: validators re-evaluate periodically based on evolving states, incorporating feedback loops (e.g., low rewards → exits → lower security → price drops → more exits). It handles uncertainty (via expectations) and can integrate real thresholds like market depth or economic concentration—e.g., how the top 10 wallets (controlling >25% issuance) or top 50 (>50%) could adversarially influence via coordinated exits or attacks, stalling the network through reduced competition and value dilution/liquidation. We’ve seen hints of this scenario under Polkadot’s reform history, where subsidised structures may have contributed to stagnation (Parachain’s 2% total issuance holding to date).
I don’t mean to discourage further work—this has potential! But at this premature stage, it’s more conceptual than realistic. Fleshing it out with dynamics like the Bellman framework, community review, and clear advantages over ongoing debates could make it robust. Testing on Kusama first for real-world data would be ideal.
What do others think? Could dynamic models reveal overlooked risks for issuance policy comparison?